Did you know there is a periodic table application in your calculator? It allows you to view every element along with nearly all of their properties, and lets you to export data to manipulate freely. With this powerful tool built right into your calculator, you’ll never have to rummage through your folder, flip to the back of the textbook, or search online to reference a periodic table.
Access the App
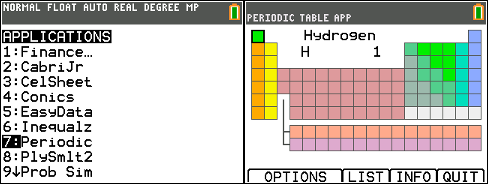
To access the table, press apps and scroll down to Periodic. You immediately access the color-coded periodic table and can use the arrow keys to navigate to the different elements.
View Element Properties
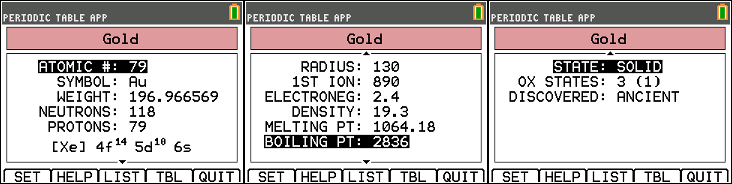
To view an element’s properties you can either navigate to its square with the arrow keys, or access the list by pressing zoom. Once in the list you can press zoom again to sort it alphabetically if you don’t know its atomic number. In the pictures below I’ve selected to view Gold.
Here you are provided with the following elemental properties:
- Atomic Number
- Symbol
- Weight
- Number of Neutrons
- Number of Protons
- Electron Configuration
- Radius
- 1st Ionization Energy
- Electronegativity
- Denisty
- Melting Point
- Boiling Point
- State at Room Temperature
- Oxidization States
- Year of Discovery
To view the units associated with these properties just press y=.
Export Data
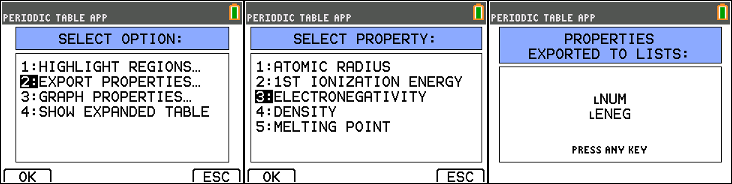
You can also take data and export it into lists to perform calculations. Press graph to return the to the table screen and then window to access the options the options menu. Try selecting Export Properties and choose Electronegativity. A pop-up message will notify you of the names of the exported lists. Exit the application and access the lists by pressing 2nd → stat and scrolling to the bottom.
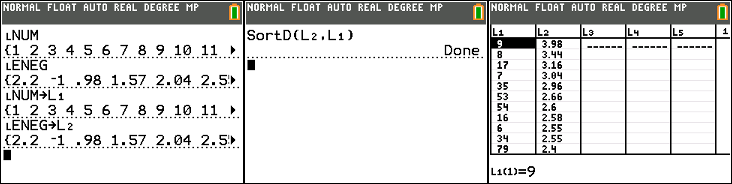
Though you can view them on the main screen, it’s more helpful to place them into tables with the following commands:
: LNUM→L1

: LENEG→L2
You can now the view the lists by pressing stat and selecting Edit…. While this is nice, it would be more helpful to sort the elements by their electronegativities:
:SortD(L2,L1)
This command sorts the second column, electronegativity values, in descending order (highest value first) and keeps the values with their corresponding atomic number values. The SortD( command is found by pressing stat. You can now view the tables and see that element number 9, Fluorine, has the highest electronegativity, followed by Oxygen, Chlorine, etc.
On closer examination you will find that electronegativity decreases as you move from the top left to the bottom right of the periodic table. You just used your calculator to discover a periodic trend!
Hopefully you’ll find this app very useful in any chemistry-related class, and if you are a chemistry instructor, this app is a great tool to show students how to discover periodic trends like the example above.
Amazing article – didn’t know you could export those values to lists. One suggestion though: you in fact CAN view the original lists in the table. Just type:
SetUpEditor ⌊NUM,⌊ENEG
SetUpEditor is at [stat] + [5], while the special L char (⌊) is at [2nd] + [0 / catalog] + [ ) / L] + [enter]
Also, to reset the stat editor, just type SetUpEditor without any arguments:
SetUpEditor
Acer Customer Service
I am now not certain where you are getting your information, however great topic.
I needs to spend some time studying much more or figuring out more.
Thank you for wonderful info I used to be on the lookout for this information for my mission.
Appreciating the dedication you put into your website and detailed information you present. It’s nice to come across a blog every once in a while that isn’t the same unwanted rehashed material. Excellent read! I’ve bookmarked your site and I’m including your RSS feeds to my Google account.
Hey I can’t see the periodic table app on my TI-84 Plus Silver Edition.